

How do you show how a software product changes over time? At a code level?
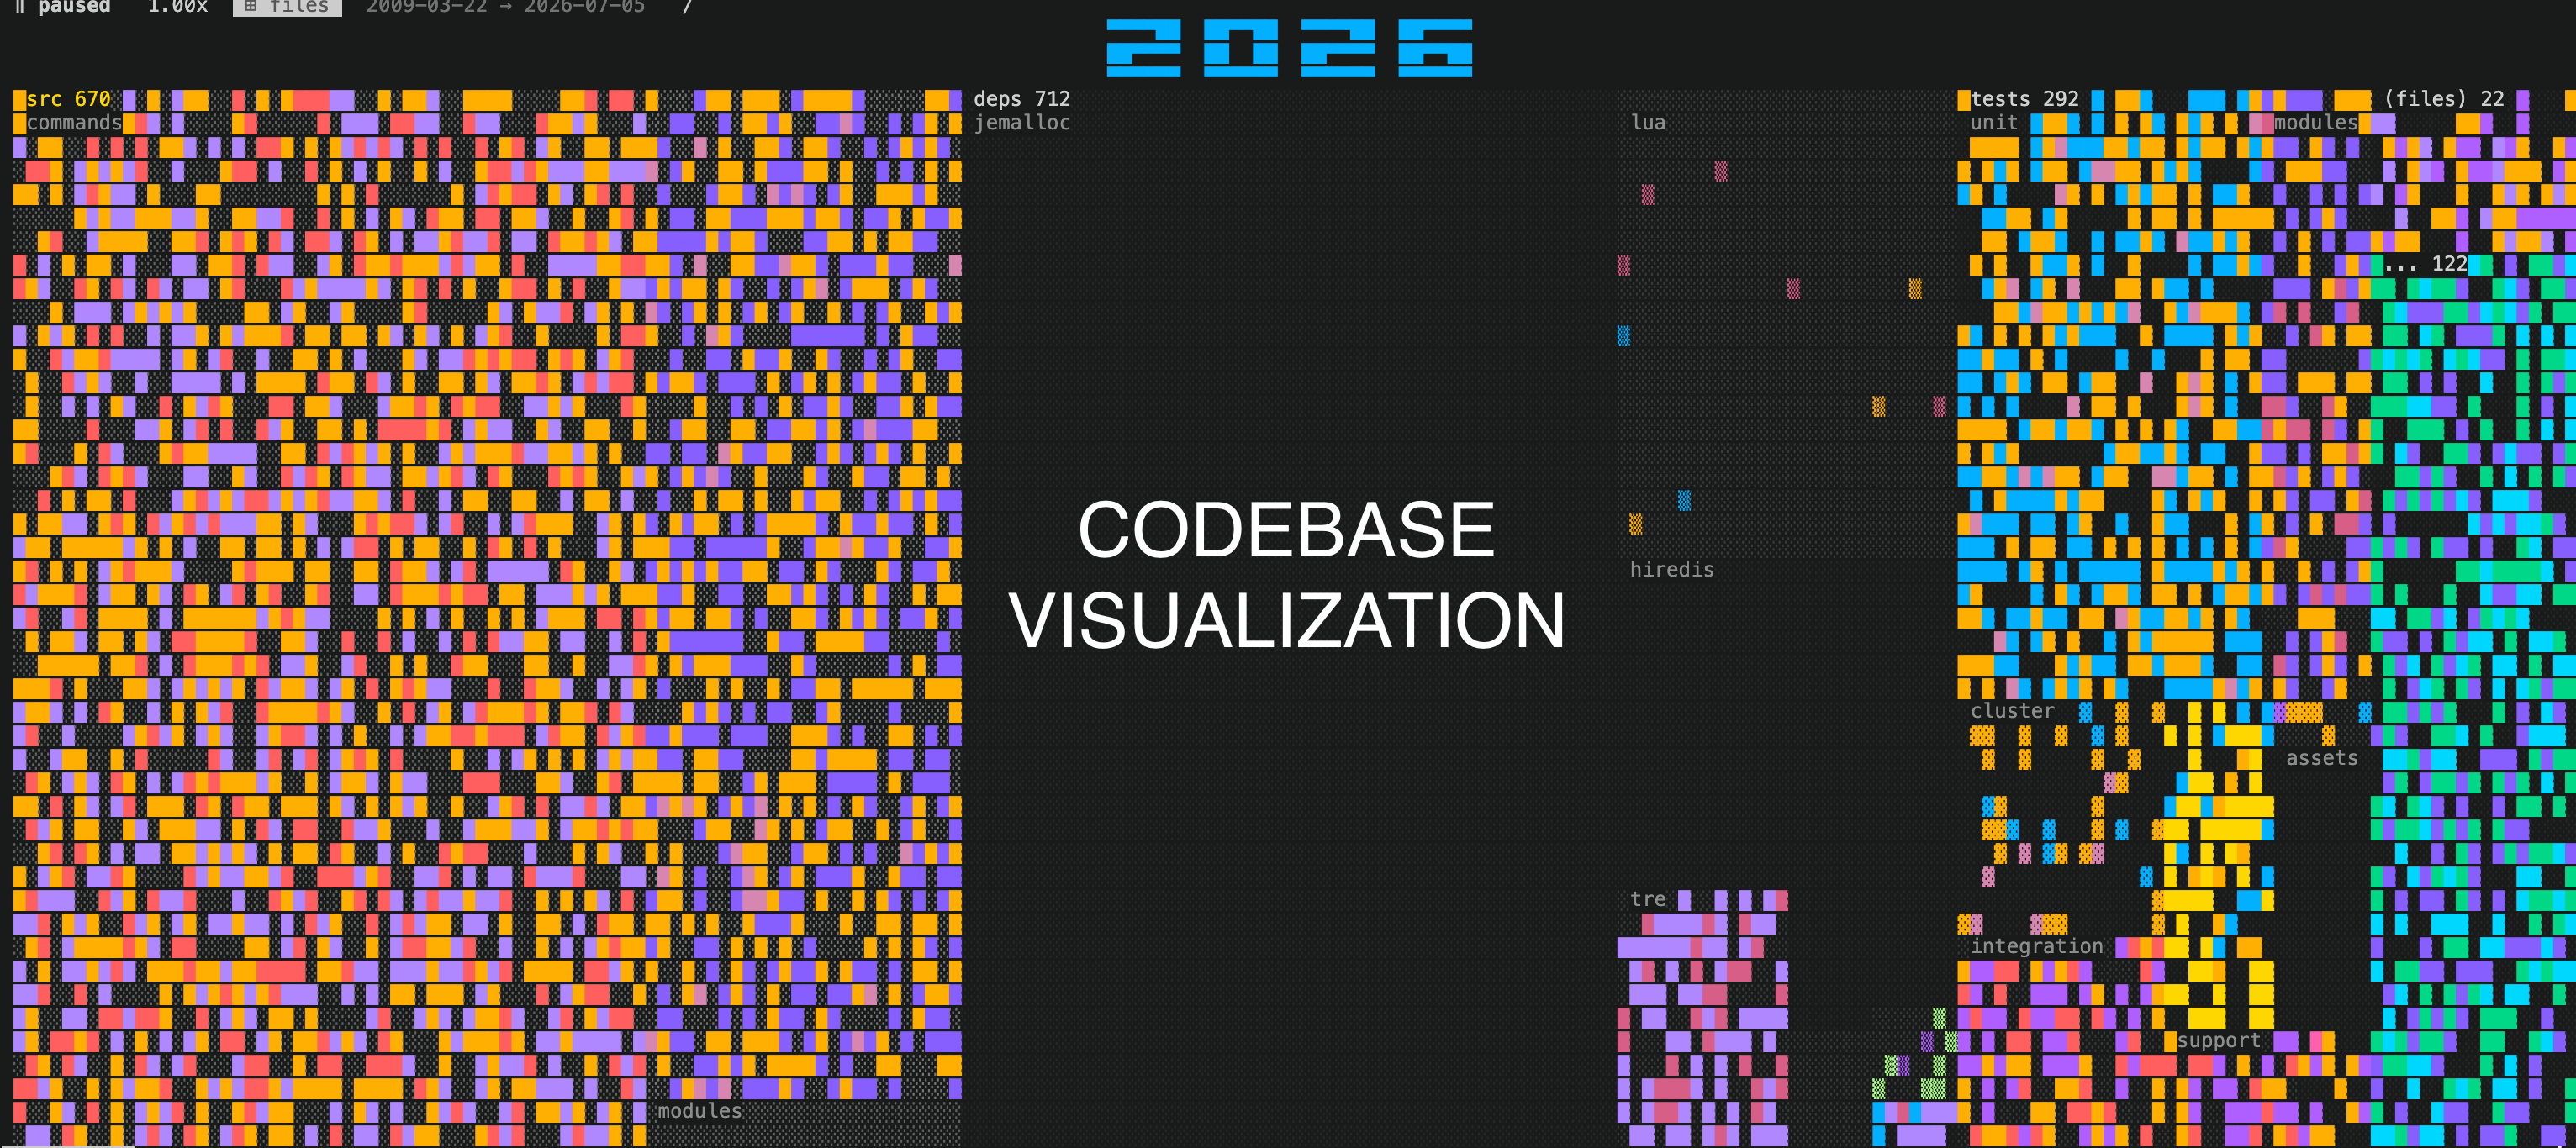
There are 13,000+ commits across 17 years in ~50 seconds.
In git repo logs, you have information about what file was modified, added, deleted or touched in some way. This is important for codebases because it gives teams the ability to trend and track code over time.
This is how it works at every organization: there are people, and processes that modify code over time. Those changes then get pushed into production systems.
This visualization follows the history of Redis, an open-source, in-memory database. Because its development history is public, we can examine how the code changed over time. But Redis is only the example; not the point. It is showing how code evolves over time.
This particular visualization is an aggregation of the lines of code worked within an area (directory). Even if a line of code was deleted, it is counted. This is to show density of where the actual work of the engineering went.
Each block is a directory, sized by accumulated work, colored by who touched it.
The expanding color palette reflects a broader group of contributors working across the codebase.
The primary areas being worked in the code are src and tests. That is the two most active regions. They are lighting up across all time.
There are three major events to watch in the video:
Take note of the dependency update in 2017 to jemalloc. This was a large addition to the codebase, that was then later removed that year. This is why the visualization of work instead of raw files matters. Effort went in, and was then extracted.
Take note of the dependency update in 2018 to jemalloc 5.0.1. This is the big update. You can see the deps region flare up. ~88,000 lines of code were changed in a single day.
Take note of when Redis creator, Salvatore stepped down in 2020. Shortly after that, you see that there is a full transition to a new team of engineers, resulting in a change of color patterns.
When systems undergo large systemic changes, such as dependency updates or new staff, it can require a lot of transitional work to get the software back into a good working state.
You can see the Human patterns in the data.
Visualization - custom tooling